One number the whole team could win together
Clients left every week and new ones started. Looking at either one alone told half the story.
The situation
A service company with about $3M in revenue and 30+ employees had fully embraced EOS®. Operations were getting better. Revenue still fell short for months, and the decline forced layoffs. The leadership team was frustrated: so much was improving, and this felt like a punch in the gut.
The measure
Net clients = new clients who started − clients who left, each day.
Every week some clients left and new ones started. A strong week for new clients could hide a bad week for departures, and the other way around. The net change answered the question the team cared about: are we growing?
What the team saw
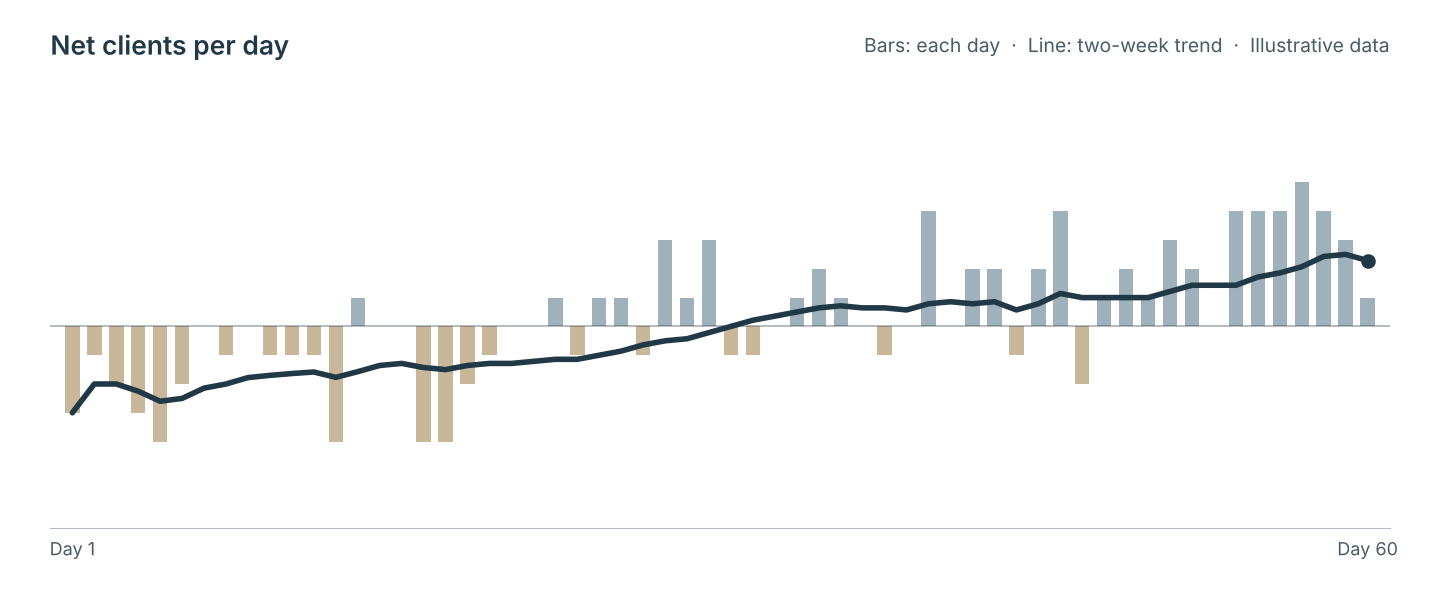
Illustrative chart, not the client's data. Single days bounced around, and some were negative. Watched as a trend over weeks, the line climbed.
The decision it changed
The leadership team watched the daily net change together and won or lost as one team. Bad days still happened. The upward trend gave them the confidence to stay the course.
How we build this at Next Sage Group
We pull client starts and departures from the system you already use, calculate the daily net, and show the trend on your Dashboard beside the Growth Plan.
From Bruce's work before Next Sage Group. Client details are withheld.
Two years later, the company is doing great.