For Visionaries

You want growth. Does your team want the same pace?

Your company runs on EOS®, your Leadership Team is strong, and the business runs. But a team can agree on the plan and still not agree on the pace. We line up your own data against your Growth Plan and show the trend and forecast, so you can see whether you are growing as fast as you want, and whether your Leadership Team sees it too.
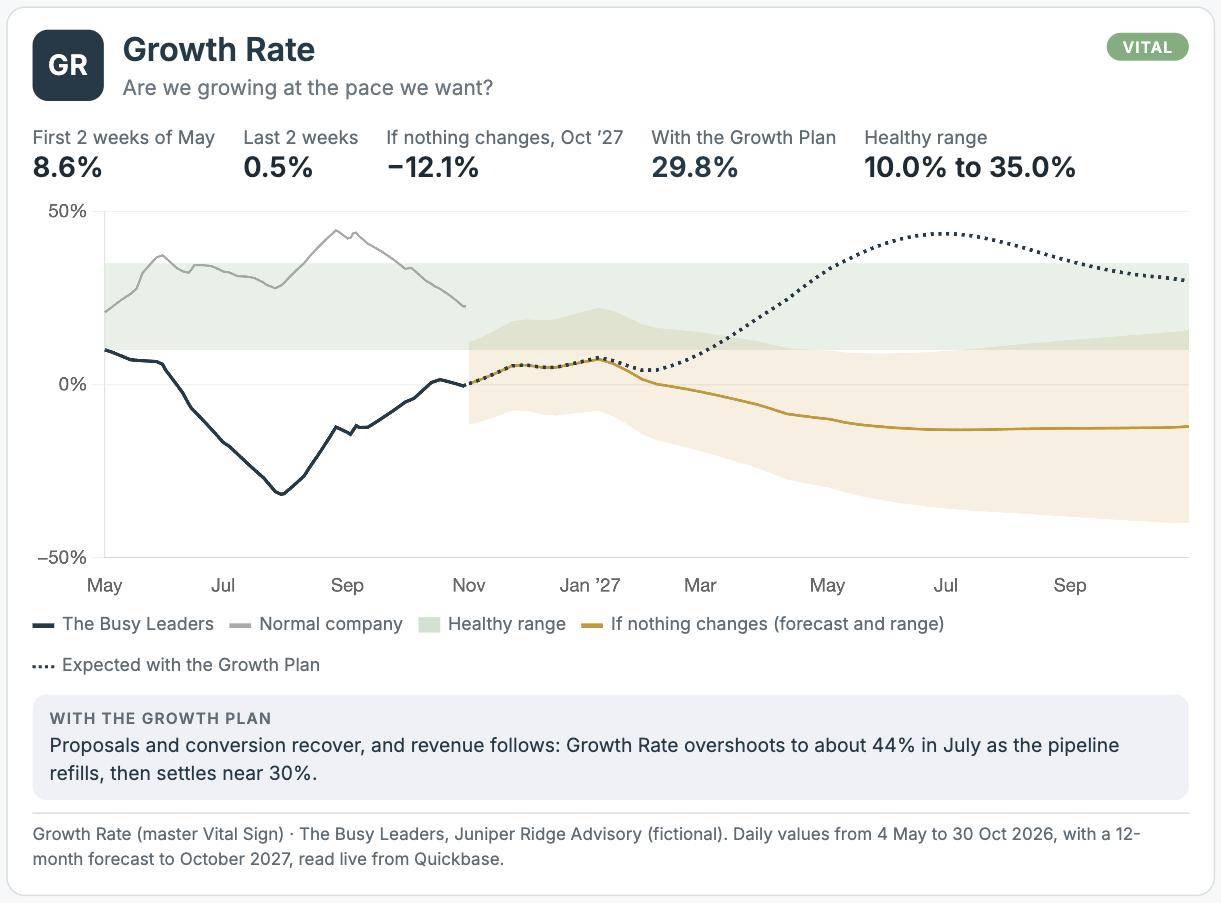
Growth Rate chart from the Growth Dashboard: where growth lands if nothing changes and with the Growth Plan, for a fictional example firm
Same page, different pace

Your team can agree on everything except how fast to grow.

A Visionary who runs EOS® wants growth. That doesn't mean your Leadership Team wants the same amount, or the same speed. A team of strong fixers can run every L10 meeting well, finish every Rock and still grow slower than you want. Better is not always bigger. The Dashboard shows the trend and forecast, then asks one question: are we good with where this lands?

Too slow

The most common answer. The company is improving, but at this pace it reaches your goal years late. We help your team pick the few things that change the trend and forecast.

Too fast

Less common, and worth knowing. Growth that outruns operations can break execution before it pays off. Sometimes the honest advice is to slow down.

Just right

Keep going, and keep watching. A forecast is not a promise, so the trend and forecast stay in front of your team every month.

What we often see

The business runs. The Growth Plan drifts.

Leadership Teams are often made of great fixers. Every week the Issues List gets worked, and that work matters. Growth is different. It needs someone watching the few numbers that move revenue.

The 1-Year Plan number repeats

This year's revenue goal can look a lot like last year's. The plan is sound. Nobody is steering toward it week to week.

The Scorecard shows the work

The Weekly Scorecard tells you whether the team did what it committed to. It doesn't always show whether that work is adding up to the goal.

Rocks lean toward fixing

Quarterly Rocks tend to go to the problems in front of the team. Often few or no Rocks are aimed squarely at growth.

What you get

A clear view of growth, built from your own data.

Your Growth Plan

We start from the plan you already run. If growth isn't spelled out yet, we build the Growth Plan with you as part of the free start.

Your Dashboard

Your own numbers, lined up against the Growth Plan, so the trend, the forecast and the Growth Levers behind revenue are in front of your Leadership Team every month.

Two calls a month

We walk through the data and the Dashboard with you and show where the plan is on pace and where it's drifting, while there's still time to act.

Before you sign anything

See your own Dashboard before you decide.

For qualified companies, we build your Growth Plan & Dashboard free, on your real data and under an NDA. If it shows a real opportunity, we talk about working together. If it doesn't, we'll tell you plainly.

3-Year Picture · Illustrative
Pace toward your vision
Revenue
58% of target
Profit
41% of target
Compared with similar companies
66th percentile, modeled
Forecast at this pace: behind your 2-year target. Too slow? Example only, not client data.

See where you are. Know where to go.

Start with the Growth Benchmark to see how you compare. Or get the free guide to the 15 Growth Levers and the 7 Vital Signs.