For Integrators

You run the weekly rhythm. Here's the growth view to go with it.

As the Integrator in a company running on EOS®, you keep the Leadership Team in sync and the business on track. We give you a Dashboard that ties the weekly numbers to the Growth Plan, so you can bring your Visionary a clear answer on growth, not only on execution.
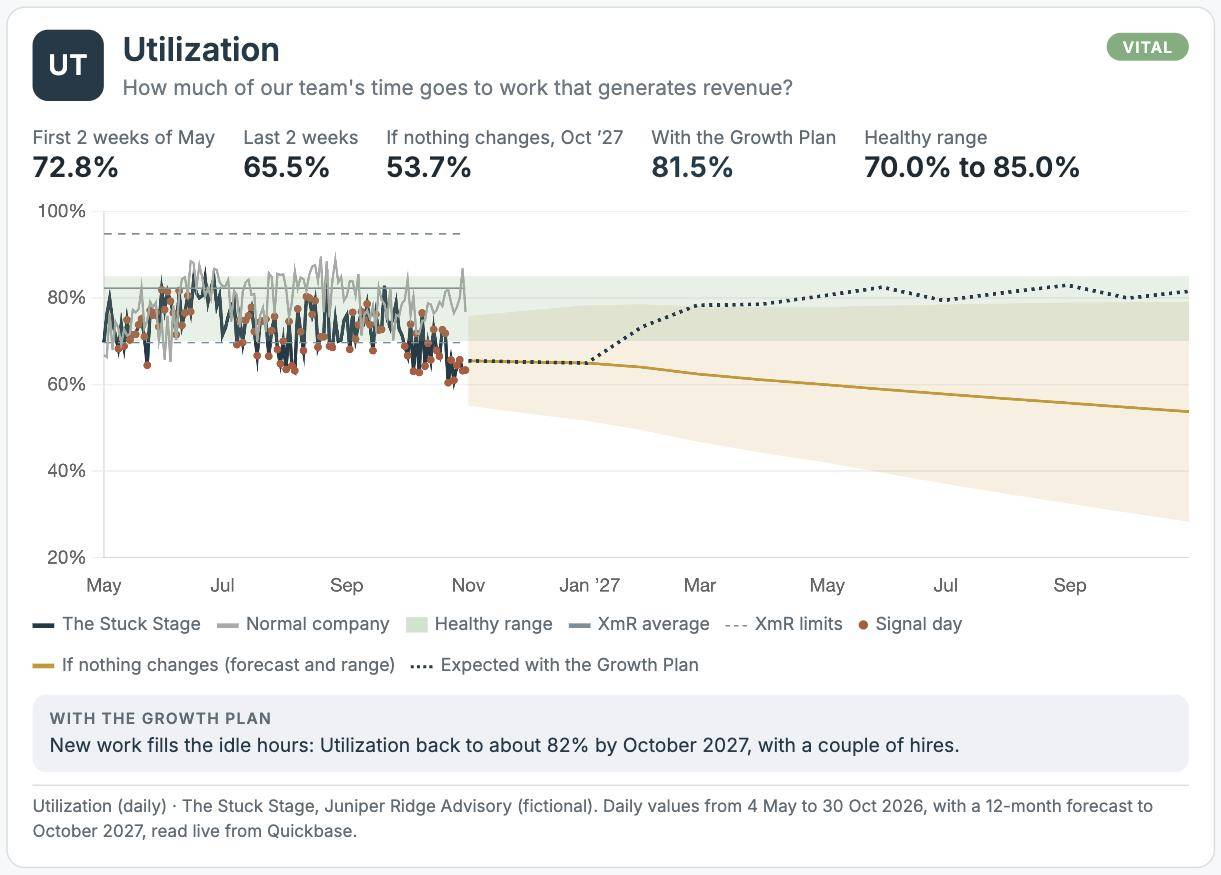
Utilization chart from the Growth Dashboard: daily trend, healthy range and forecast with the Growth Plan, for a fictional example firm
If you're the Integrator

Make growth part of the weekly rhythm.

You already own the meeting pulse, the Issues List and the follow-through. Growth needs the same attention, and it rarely gets it on its own.

One view of the plan

Data from the systems you already use, lined up against the Growth Plan in one Dashboard.

The Growth Levers behind revenue

We identify the few Growth Levers that move revenue and tie them to your Weekly Scorecard, so on pace or off pace shows up early.

A clear read for your Visionary

Two review calls a month give you a plain read on the plan to bring to the Leadership Team and your Visionary.

No Integrator yet?

Someone has to own the plan. We can help hold the seat.

Many companies running EOS don't have a full-time Integrator yet, and the Visionary ends up carrying both seats. Until the seat is filled, we can coach the person stepping into it, or step in part-time ourselves.

Coach your COO

$2,995 a month, added to Care & Review

Bruce works one-on-one with your Integrator or COO on running the business against the Growth Plan: setting priorities, leading the Leadership Team and acting on what the Dashboard shows.

Fractional COO

$6,995 a month, added to Care & Review

We step in as your part-time COO to drive the plan, hold the owners of each Growth Lever accountable, and help you build the team to run it yourselves.

Before you sign anything

Both paths start with the same free build.

For qualified companies, we build your Growth Plan & Dashboard free, on your real data and under an NDA. You see it before you decide, and we'll tell you plainly if it isn't a match.

Weekly view · Illustrative
Growth Levers vs. plan
Qualified opportunities
82% of plan
Close rate
64% of plan
Gross margin
96% of plan
Revenue per employee
74% of plan
Focus next: close rate. Example only, not client data.

See where you are. Know where to go.

Start with the Growth Benchmark to see how you compare. Or get the free guide to the 15 Growth Levers and the 7 Vital Signs.