← All 15 Growth Levers
RS
Economics
Growth Lever

Client Results

Are clients getting the results they paid for?

What it looks like on the Dashboard
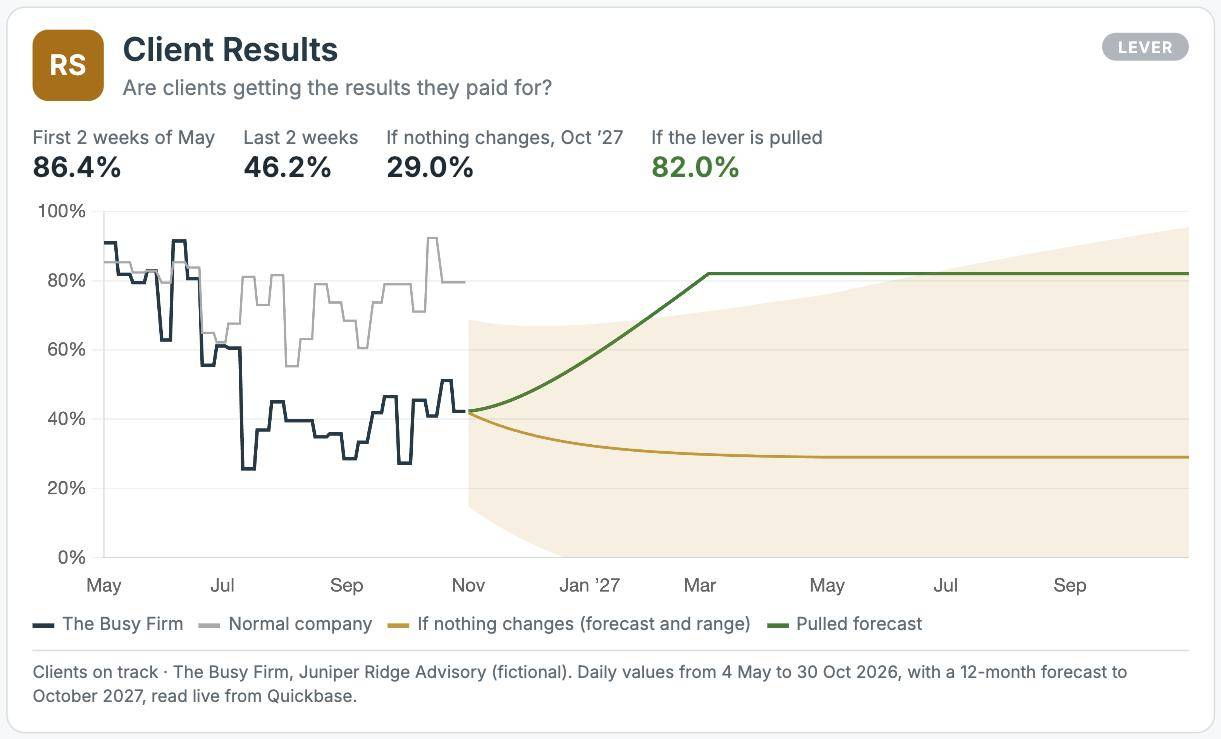
The Busy Firm. Clients on track fell from 86% to 46% as the team stretched thin. If nothing changes it falls to about 29%. With weekly recovery plans and the new capacity, it is expected back at 82% by March.

The Busy Firm. Clients on track fell from 86% to 46% as the team stretched thin. If nothing changes it falls to about 29%. With weekly recovery plans and the new capacity, it is expected back at 82% by March.

Illustrative. Juniper Ridge Advisory is a fictional firm with a full year of modeled data, analyzed the way we analyze yours.

How to calculate it

At kickoff, agree on two or three measurable outcomes with each client. Then track the share of clients on track, weekly.

For example

32 of 40 clients on track is 80%. If the 8 who aren't are also missing meetings, they're your retention risk.

Signs you need it

You measure satisfaction, but not results.

Pulling it looks like

Set outcomes at kickoff, review them monthly, and step in early when a client drifts.

Cost to pull

Time from client leads.

Watch out for

Outcomes defined after the fact. This lever drives three others: clients who get results stay, refer, and accept price increases.

Pulling a lever

One owner, one Rock, two forecasts.

Every Growth Lever on your Dashboard shows where it lands if nothing changes and where it lands if you pull it. The gap is the case for pulling it. Most companies should pull two or three at a time, sometimes four, never five.

See where you are. Know where to go.

Start with the Growth Benchmark to see how you compare. Or get the free guide to the 15 Growth Levers and the 7 Vital Signs.