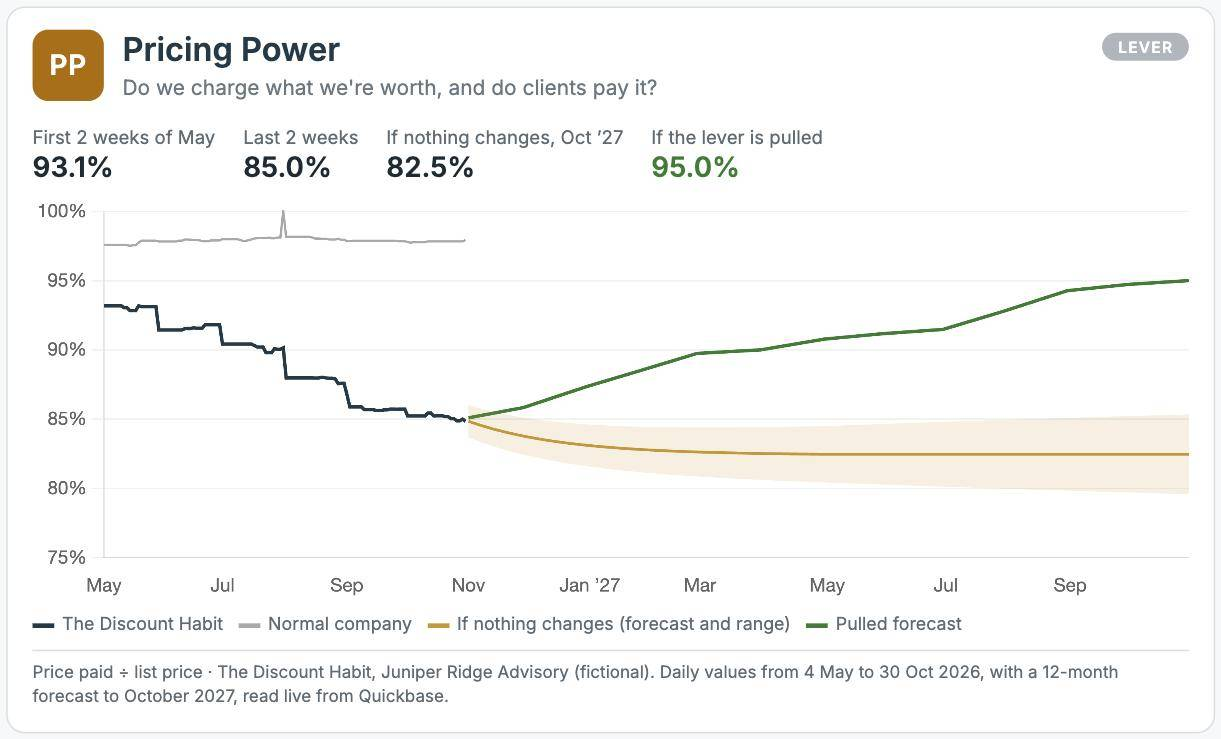
The Discount Habit. Clients paid 93% of list in early May and 85% by October, while the normal firm stayed near 98%. If nothing changes it drifts to about 82%. Ending routine discounts takes it back to 95% by October 2027, as each client's work comes up for renewal through the year.
Illustrative. Juniper Ridge Advisory is a fictional firm with a full year of modeled data, analyzed the way we analyze yours.
How to calculate it
Track three prices: the ideal price (what comparable firms charge similar clients, adjusted for whether you position as premium, on par or value), your list price, and the price actually paid. That gives two gaps. List divided by ideal is a strategy decision. Paid divided by list shows leakage from discounts, free scope and exceptions.
Ideal $13,500, list $12,500, average paid $11,900. Positioning is 93% and realization is 95%, so you're leaving about $1,600 per client per month on the table.
Prices haven't moved in years, or every proposal includes a "one-time" discount.
Discount rules and approval limits, annual increases, and pricing on value instead of hours.
Relational equity with price-sensitive clients.
The win rate. If it holds after an increase, your price was low.