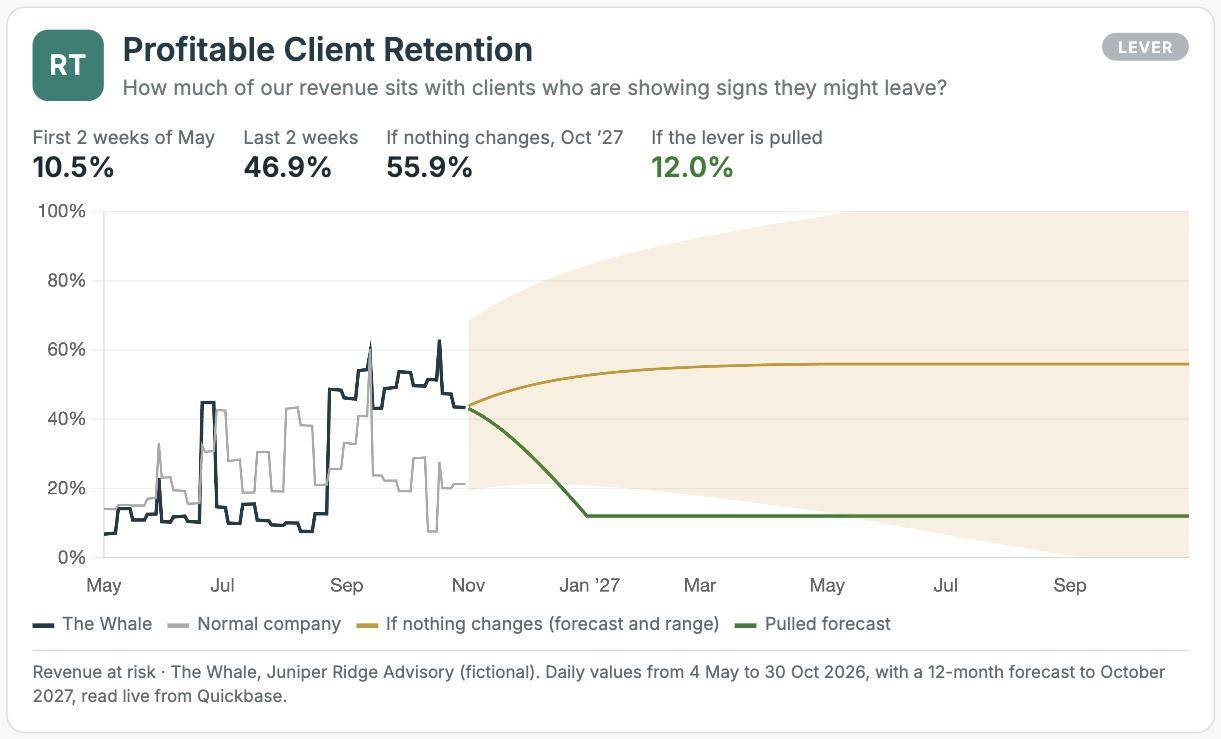
The Whale. Revenue at risk rose from 11% to 47% as the largest client's engagement slipped. If nothing changes it climbs toward 56%. Re-engaging that client brings it down to 12% by January.
Illustrative. Juniper Ridge Advisory is a fictional firm with a full year of modeled data, analyzed the way we analyze yours.
How to calculate it
Net revenue retention is this period's revenue from last period's clients, divided by their revenue last period. Margin retention is the same, using contribution margin. Track both, plus revenue at risk: the share of revenue from clients whose status is slipping or who are missing meetings.
Keeping 90% of clients sounds fine, until the 10% you lost turn out to be your most profitable.
You hear about a client leaving when they give notice.
Strong onboarding, early outreach when engagement drops, and expansion paths for your best clients.
Leadership time with clients.
Choosing to let a weak client go lowers revenue retention while raising margin retention. Report both, or a good decision looks like a failure.