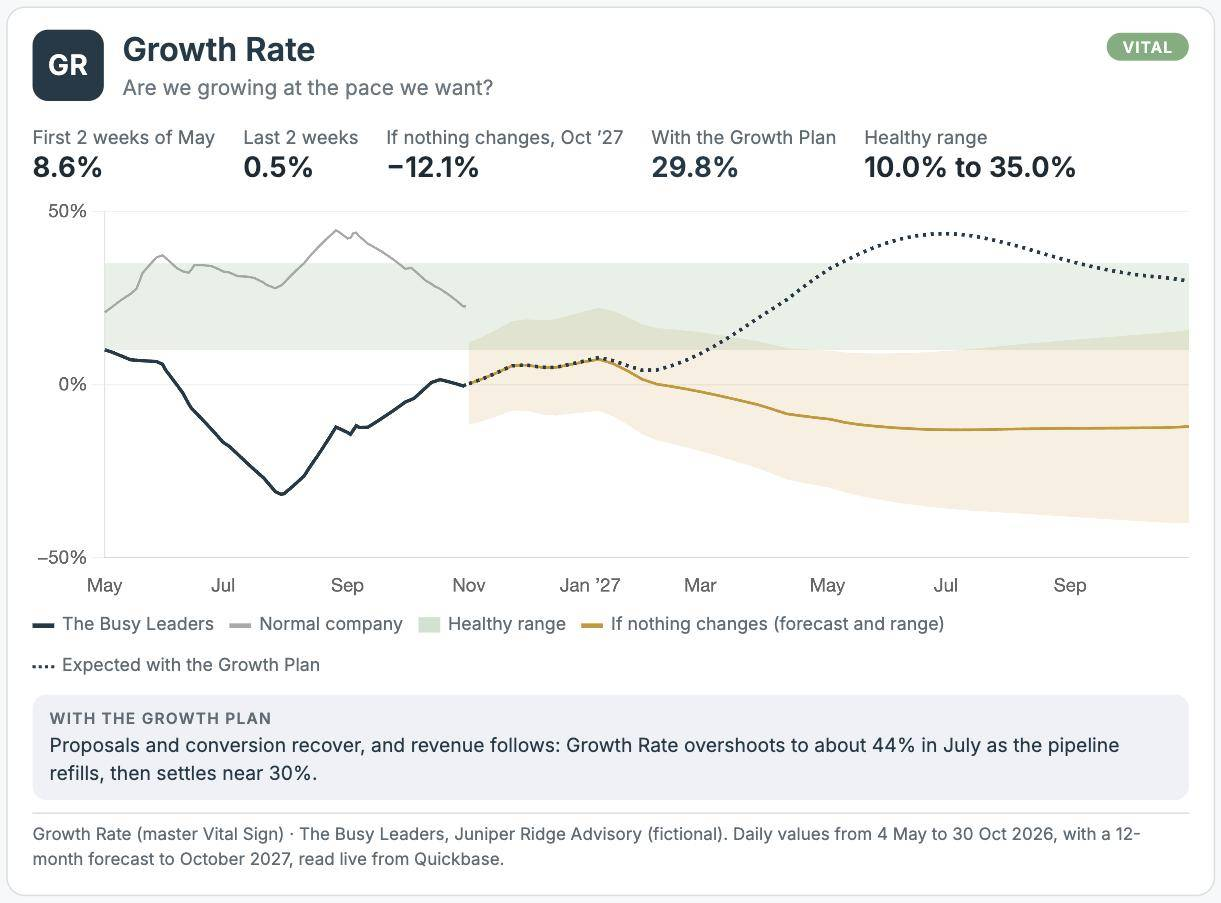
The Busy Leaders. It fell from 9% to below zero, under its 10% floor, while the normal firm stayed in range. If nothing changes it sinks to about −12% by October 2027. With leaders back at 25% growth time, the pipeline refills, and Growth Rate overshoots to about 44% in July as new work catches up, then settles near 30%.
Illustrative. Juniper Ridge Advisory is a fictional firm with a full year of modeled data, analyzed the way we analyze yours. The green band is the healthy range; the dotted line is where the Growth Plan is expected to take it.
How to calculate it
Fit a straight trend line through the last six months of daily revenue, about 126 business days. Multiply the line's daily rise by 252 business days, and divide by where the line ends today. One large invoice or a slow week barely moves it.
A trend line that ends at $27,000 a day and rises about $27 each business day adds about $6,800 a day over a year. That's a Growth Rate near 25%.
Set by the Visionary, with a floor and a ceiling. In our example it's 10% to 35%. The ceiling is the pace your people and cash can keep up with.
Proposals aren't converting, the pipeline has thinned, or clients are leaving faster than new ones arrive.
Hiring falls behind demand, Utilization climbs, and cash gets tight.
Almost every lever. Start with the ones your numbers point to: the Journey levers when new work stalls, the People levers when capacity is the limit, Days to Get Paid when cash is.
Reading a short spike as a problem. Recovered prices or a refilled pipeline can push it over the ceiling for a few months, and that's fine if it comes back down. The problem is a rate that stays above the ceiling, or keeps rising.