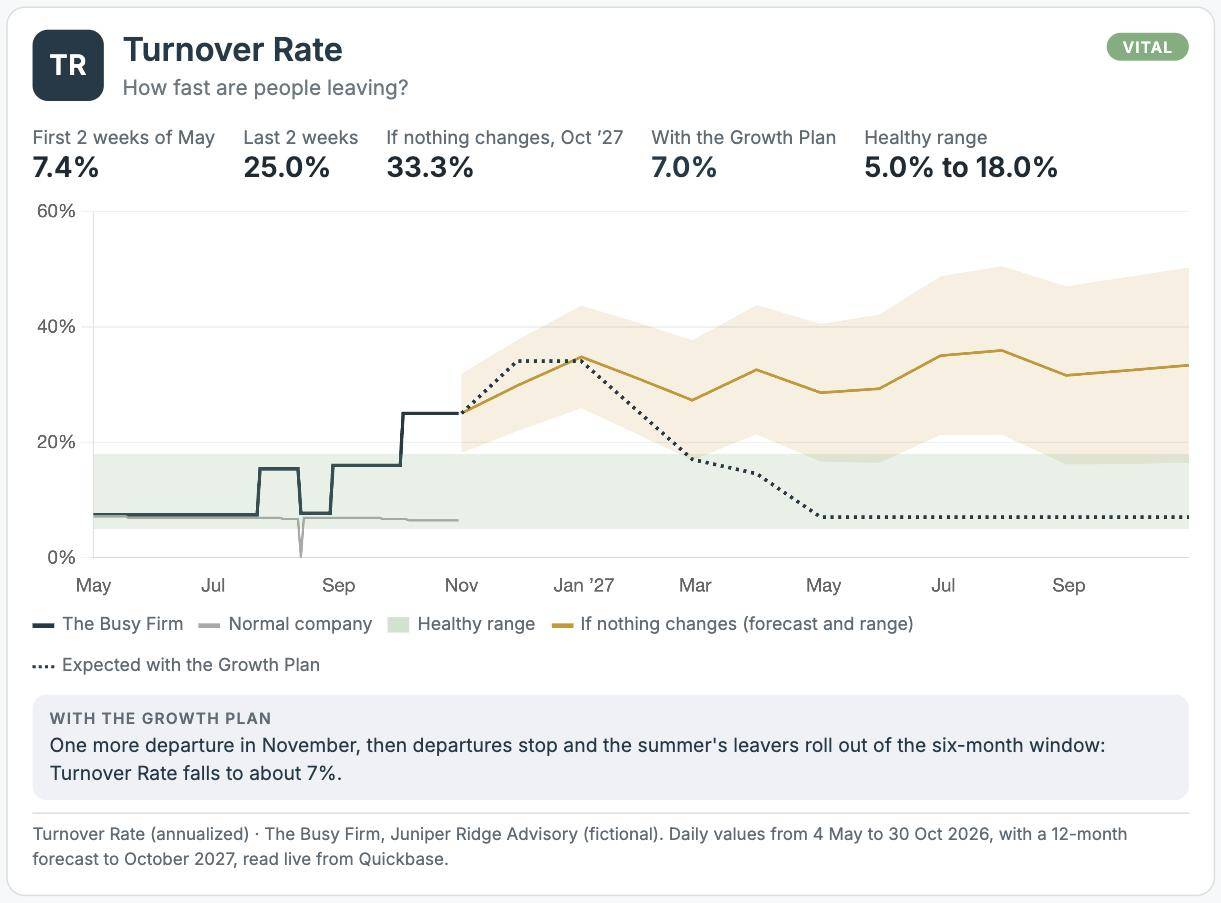
The Busy Firm. It stepped up from 7% to 25% with each regretted departure, well above its 18% ceiling. If nothing changes it stays above 30%. With the Growth Plan, one more departure lifts it briefly, then it falls to about 7% by May as the summer's departures roll out of the six-month window.
Illustrative. Juniper Ridge Advisory is a fictional firm with a full year of modeled data, analyzed the way we analyze yours. The green band is the healthy range; the dotted line is where the Growth Plan is expected to take it.
How to calculate it
Departures over the last six months, doubled to make an annual rate, divided by average headcount. Track regretted departures, the people you wanted to keep, on their own.
Two departures in six months at a 25-person firm is four a year, or 16%, inside the range. Three in the same six months would be 24%, above it.
5% to 18%.
Hard performance conversations may not be happening.
Capacity walks out the door, the people who stay work longer hours, and more departures tend to follow.
Turnover Cost, plus Weeks Until We Hire, so help arrives before people are overloaded.
The lag. Departures usually follow months of overload, so Utilization is the early warning. And because the rate counts six months, one bad quarter stays on the chart for half a year.