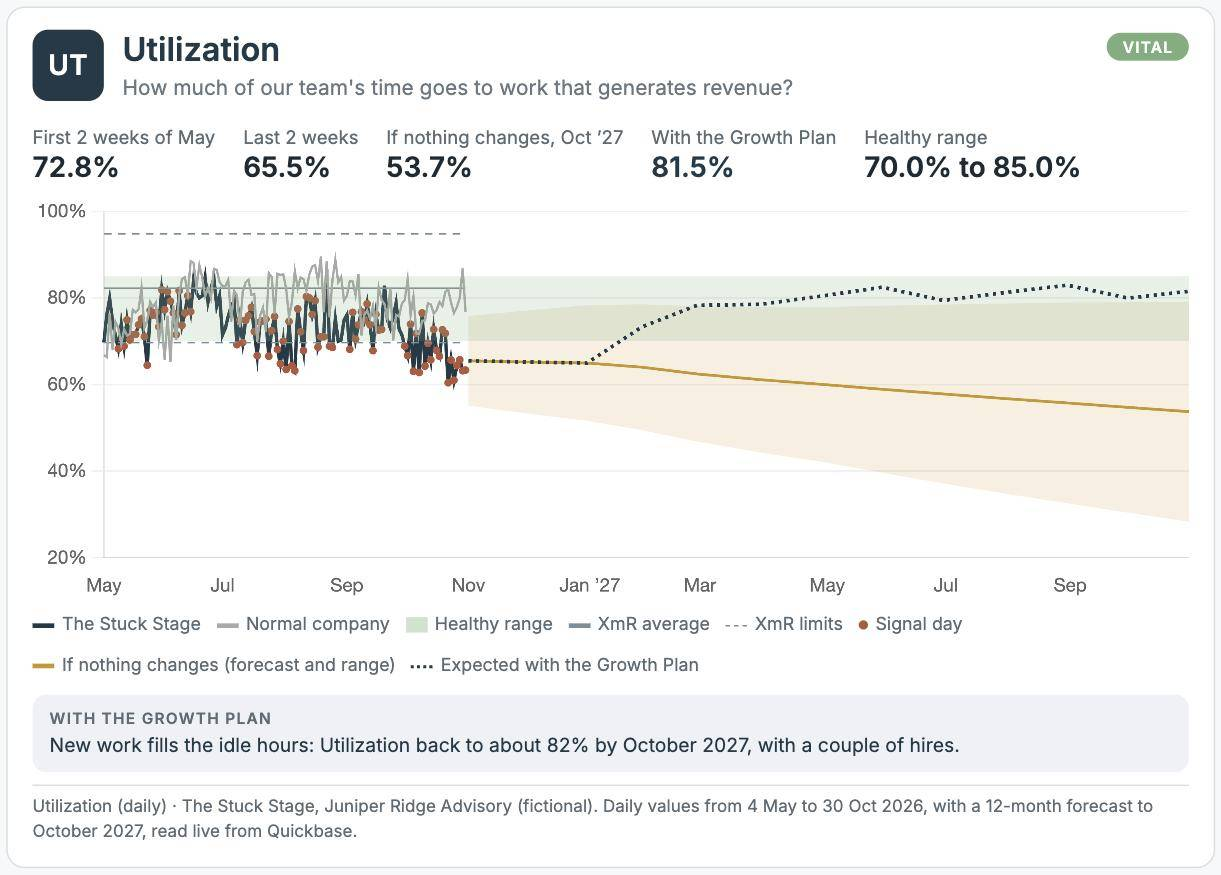
The Stuck Stage. Measured daily, with XmR limits and signal days marked. It drifted below its 70% floor in October. If nothing changes it falls to about 54% as clients leave and nobody replaces them. As follow-up returns and more proposals convert, new work fills the idle hours: about 82% by October 2027.
Illustrative. Juniper Ridge Advisory is a fictional firm with a full year of modeled data, analyzed the way we analyze yours. The green band is the healthy range; the dotted line is where the Growth Plan is expected to take it.
How to calculate it
Delivery hours divided by available hours, for delivery roles only, over the last 20 business days. Available hours leave out holidays and time off.
18 delivery staff have 2,300 available hours over the last 20 business days and log 1,840 of them on client work. Utilization is 80%.
70% to 85% to start. Your own history sets the real ceiling: the level where growth stalled or people started to leave.
Payroll sits idle, and the pressure to discount to fill the time grows.
Deadlines slip, rework and hours climb, and the next resignation is on its way.
Client Capacity and Weeks Until We Hire add hours in time. Cost to Deliver cuts the hours each client takes. The Journey levers bring in the work.
An average that hides one overloaded role. Check it role by role, starting with your bottleneck role.