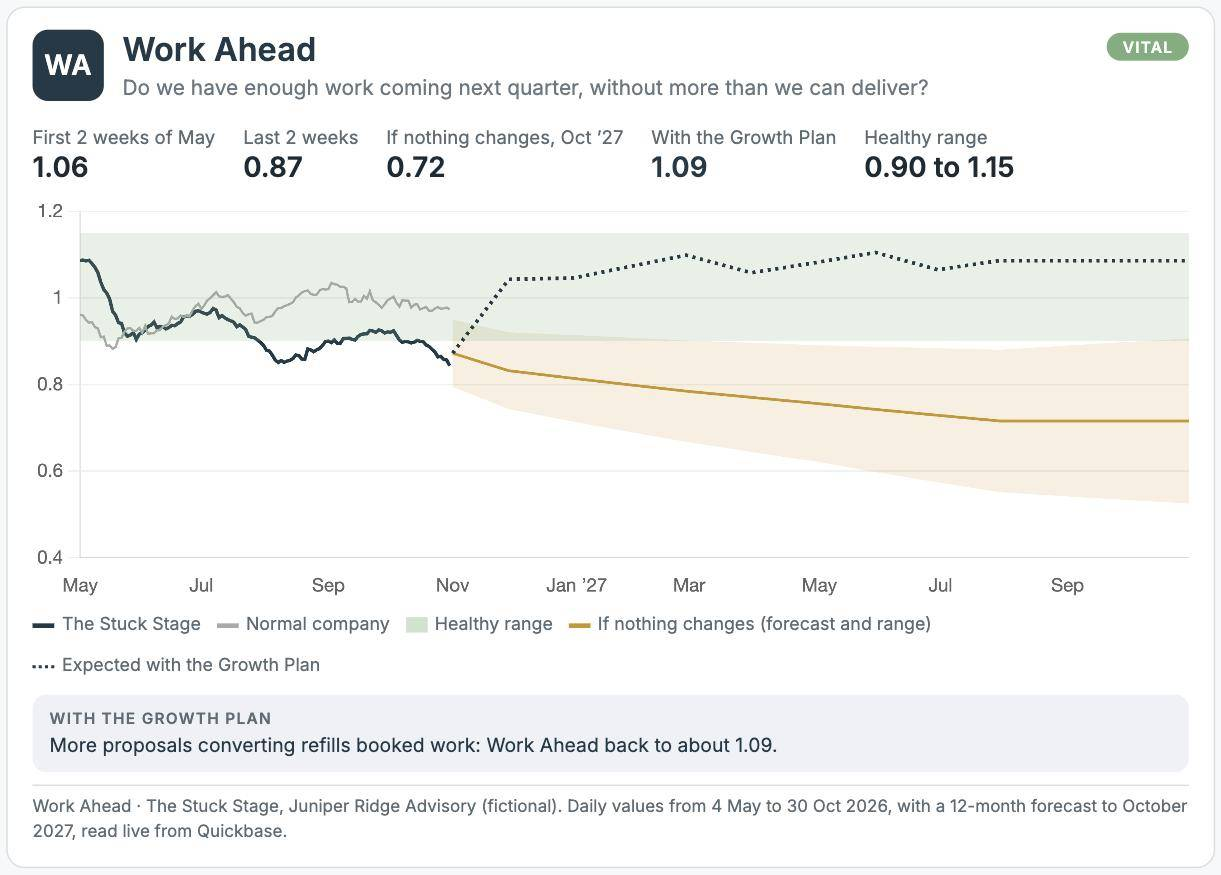
The Stuck Stage. It fell from 1.06 to 0.87, below its 0.90 floor. If nothing changes it falls to about 0.72. More proposals converting is expected to bring it back to about 1.09.
Illustrative. Juniper Ridge Advisory is a fictional firm with a full year of modeled data, analyzed the way we analyze yours. The green band is the healthy range; the dotted line is where the Growth Plan is expected to take it.
How to calculate it
Hours already committed for next quarter, plus the hours in open proposals weighted by their chance of closing, divided by 85% of the hours your delivery team will have available.
2,000 committed hours plus 2,000 hours of open proposals at a 40% win rate is 2,800 hours. 85% of 3,000 available hours is 2,550. Work Ahead is 1.10, inside the range.
0.90 to 1.15.
Capacity is about to sit idle.
You've won more work than you can deliver, and hiring happens in a rush.
Funnel Steps, Sales Habits and Profit by Channel fill it. Weeks Until We Hire adds the hours to deliver it.
Win rates that are hopes. Use your own conversion history at each stage, not how confident the proposal feels.